


Press play to start listening
We’re living in a data-driven world, and this means that it’s imperative to share information in the most engaging and effective way possible in order to reach your audience without the risk of having your message lost in communication.
As the data available to us becomes richer and more complex, it’s essential that we look to share our insights in the most manageable way possible – without bewildering our audience with too many numbers or unmanageable levels of insight.
Whether you’re looking to present findings to your peers, or are interested in sharing data online, infographics can be the most impactful way of getting your message across in an engaging manner.
When created effectively, infographics can be eye-catching, easy to follow, and highly informative.

As the visualization above shows, there can be many important components that go into structuring a good infographic. Factors like raw data, design, shareability and storytelling are all essential in crafting a memorable graphic that can really underline the conclusions that your findings have drawn.
But how can this process be undertaken effectively? For many of us, the task of compiling rich information into qualitative data that’s visually engaging can be a difficult task, but fortunately, Powered Template is a strong solution that offers pre-designed and 100% editable slides for users to pick up and create engaging content from.
Let’s take a deeper look into how it’s possible to create rich data-driven infographics with the help of Powered Template:
Finding Your Infographic Template
Your infographic template will be the foundation of your visualization, and with this in mind, it’s essential that you pick a design that not only looks at the part but is also capable of conveying the data that you have.

As we can see from Powered Template’s rich library of resources, there are nearly 1,500 infographic templates to choose from, each with its own characteristics and format.
It’s also important to note that some templates are entirely free to download, whilst others are content that’s exclusive to subscribers. Paid-for templates are signified by a small red thumbnail to the bottom right corner of an option depicting a crown.
Helpfully, each template comes equipped with a simple star rating system that depicts levels of user satisfaction.

Let’s take a deeper look at one of our options. As we can see, this template has been designed to display the pros and cons of a certain product, idea, or topic. Immediately, we can see that the template has been given a 4.5-star rating from 306 reviewers, whilst the infographic has been downloaded a total of 441 times.
Crucially, we can also see that the template is compatible with both Microsoft PowerPoint and Google Slides, and was created in December 2020. We are also able to see that downloads come with two slides, one light, and one dark option.

If, on closer inspection, the template isn’t quite what you were looking for, clicking on ‘similar’ will display other options that are determined to possess close matches in terms of functionality.
Downloading Your Infographic
Once you’ve decided which infographic you would like to download, the process of making the file your own to use begins.

Because our chosen infographic is available for free for non-subscribers, we have the option to download it without having to sign up to the website – provided that we add an attribution on the content.
Alternatively, it’s possible to ‘go premium’ and download the file without having to attribute it. For subscribers, Powered Template’s extensive catalog of resources can be accessed for $19 per month.

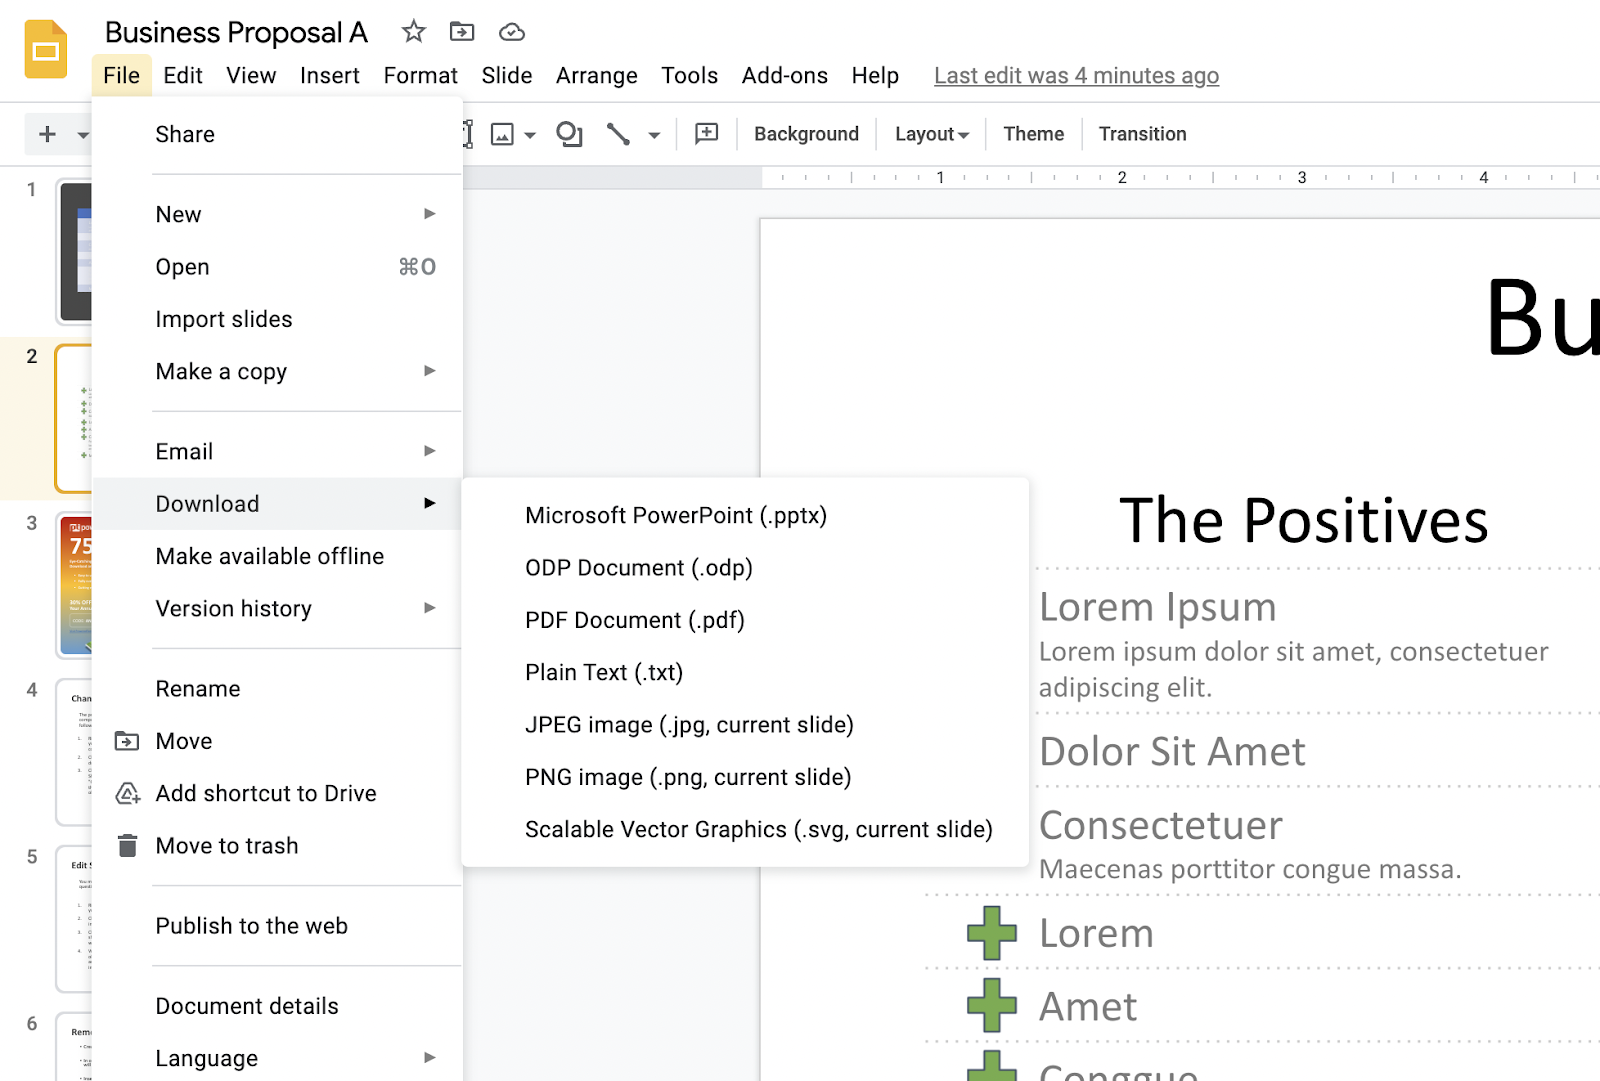
When it comes to downloading your content, Powered Template will provide a clear choice to ensure that the correct format is selected. The platform can even remember your preferences to make downloads more efficient.

Once downloaded (or, in the case of Google Slides, copied onto the platform), we can finally get to grips with our content. Here, we can see that our download is accompanied by extra slides that offer instructions on how to edit the content – as well as some pointers when it comes to making additions to the infographic.
It’s worth remembering that Powered Template’s content is all 100% editable, allowing users to do whatever they want with their downloads.

Using the guide attached, it’s been possible to tweak the content in order to mold it into something that sufficiently supports its intended goal.
Given that the content is fully customizable, it’s possible to make changes and additions, as well as take creative license as much or as little as possible.
It’s even possible to compile different infographics to create a more comprehensive data overview to support your report or findings.
Although presentations are a powerful tool for sharing information, your audience may be a little limited. However, most software allows users to download their content as an image which can be uploaded and shared online across social media platforms or internal business communication platforms – just to help your findings reach further audiences.
In an age that’s heavily governed by data, Powered Template offers a leading solution in making striking infographics and other forms of data-driven visualizations. Whether you’re looking for a quick free template or to subscribe to a reliable service to bring your many insights to life, there are a few better platforms to turn to than Powered Template to cater to your needs.